Spending Analysis
whitesky.cloud BV Spending analysis is a cloud business intelligence tool designed to provide our customers with all the necessary insight and analytics for efficient cost management. Spending analysis overview provides a summary of the customer's commitments on daily basis and allows admins to discover and analyze trends. The customer's cost structure can be discovered at a glance, for example, by visually comparing the costs of the individual resources or locating consumption picks throughout the billing period on the spending graphs.
How to check your spendings on whitesky.cloud BV ?
To access your spending graphs navigate to in navigation bar.
Types of charts
-
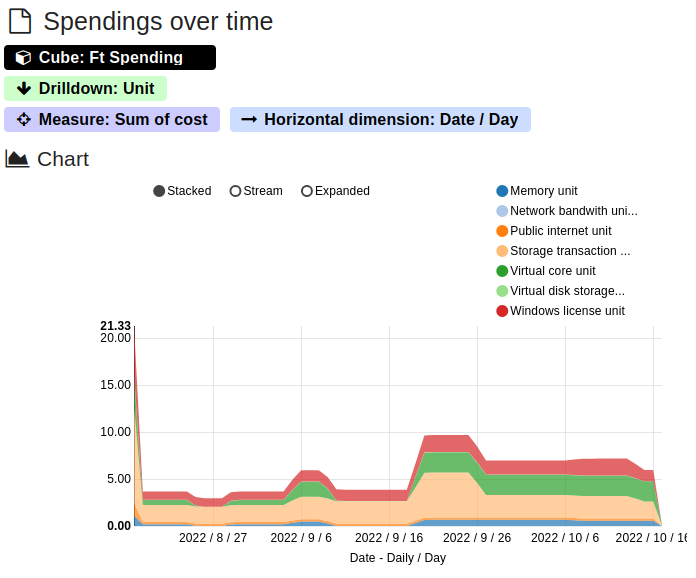
Spendings over time - which represent the total spendings of all units over an interval of time.
-
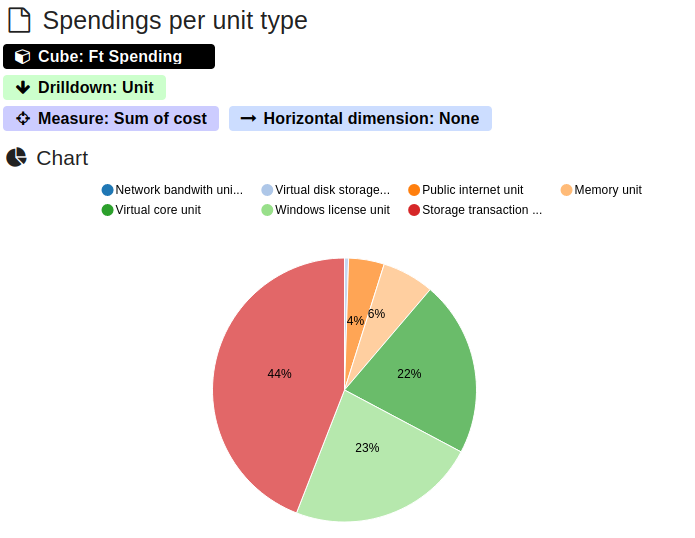
Spendings per unit type - which represent the total spendings per each used unit.
Configuring charts
whitesky.cloud BV Spendings allows you to fully control your spendings charts, which helps you get the required information directly.
Charts external configuration
You can change the external view of your charts whether display charts in column view or hide/show controls.
-
To change the column view
- Click Tools and turn off the 2 columns.
-
To hide/show controls
- Click Tools and turn on the Hide controls.
Charts internal configuration
You can control the internal configuration of your charts from different perspectives. On the top of every chart, you can see the configuration bar, which contains multiple options like:
-
Type of data to represent
- Supports four views of data representation which are:
- Aggregated data (Sum of Ammount & Sum of Cost)
- Facts data
- Series table (with horizontal dimensions: day, month and year)
- Chart (with horizontal dimensions: day, month and year)
- Supports four views of data representation which are:
-
Drilldown
- Drilldowns are a powerful feature to facilitate data exploration. It’s defined as a list of dimensions called drill members. Once defined, these drill members will always be used to show underlying data when drilling into that measure.
- The measures available are:
- Units
- Resources
- Dates (weekly and daily)
- Location (starting from Country and going down through City, Datacenter, Cluster until reaching single item).
-
Filter
- Filters the chart based on:
- Dimensions (including all the values available in drilldown)
- Date (fully customizable date interval)
- Filters the chart based on:
-
View
- Provides different options to change your spending analysis layout, with View you can:
- Change the Chart type, Curve type, Toggle legend (toggle dynamic filter)
- Change the Horizontal dimension (including all the values available in drilldown).
- Change the Measure (whether sum of cost or sum of amount)
- Export figure by downloading a screenshot of the chart.
- Export facts by downloading a .csv file which contains all your spending data in a single Excel sheet.
- Provides different options to change your spending analysis layout, with View you can:
-
Panel
- Allows customers to Rename, Clone, Serialize the chart.
Measuring Units
whitesky.cloud BV Spending analysis has multiple measuring units, which showcase our customers' consumption of each unit. These measuring units are:
- Memory unit
- Network bandwidth unit
- Public internet unit
- Storage transaction unit
- Virtual core unit
- Virtual disk storage unit
- Windows license unit
Resources consumption
Consumption is shown in hour-month units, as well as prices. To elaborate more, if we have this simple example: 1 VCU unit is the equivalent of using 1 VCU for a month: 30 days 24h a day, so if 1 VCU was used for 1 hour only, in the month billing it will be shown as 1/(30*24).
So the consumption is recorded hourly, but the units are monthly based. This monthly approach is only for resources of type "allocation". Check the concepts documentation to learn more about the different types of resources.
Only resources consumption are shown in the spendings analysis and licenses costs are not taken to account.
Prices are shown without VAT.
Exporting charts
In order to save the charts, you can simply click EXPORT FIGURES and the whitesky.cloud BV will download screenshots for your charts on your device.
Save chart view
If you want to save the edits that you have made on your spendings charts so you can open up the spendings again on these last edits, just click SAVE VIEW at the top of the page.